Bitrate Analysis
KLV Streamer can show a bitrate chart for an individual file or for the active playlist.
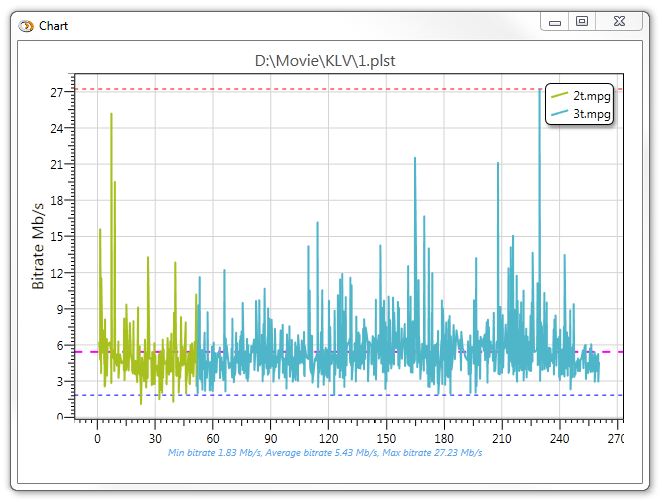
Figure: Bitrate chart for a playlist or selected file.
To display the chart:
- press the Plot Bitrate button to analyze the playlist
- or right-click an individual file to inspect only that item
PCR Discontinuity Monitoring
Transport-stream errors can affect bitrate calculations. One example is a PCR discontinuity indicator error, where the difference between two consecutive PCR values falls outside the valid range or becomes negative.
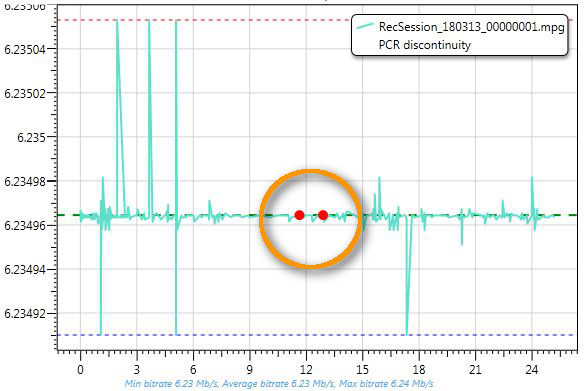
Figure: PCR discontinuity highlighted on the bitrate graph.
If the PCR difference becomes negative, KLV Streamer marks that point with a red circle on the chart so it can be investigated quickly.