Stream Analyzer
StPlayer comes with (an optional) Stream Analyzer tool. It is useful for Video / Klv analysis, and interoperability testing, to quickly identify impairments and artifacts.

Video Dts Interval
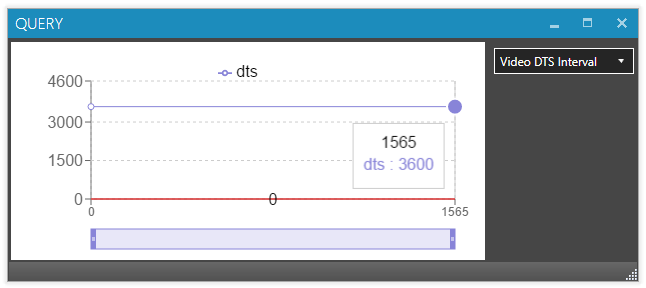
Video Dts Interval chart shows the DTS time difference between the successive video packets.
For example, here is a chart that represents a perfect stream with 3600 units (40 ms, 25 fps) DTS delta.
If there is a problem with DTS timestamps, you'll see it immediately. The chart below shows a problematic video clip where DTS timestamps have some substantial discrepancies.
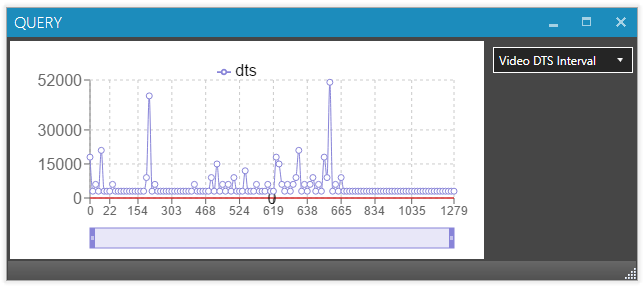
- Note
- A negative value (Non-monotonous DTS) in this chart is a serious error (of course, if the discontinuity flag is not set just before the packet or you have recorded looped video) as DTS timestamps must be continues.
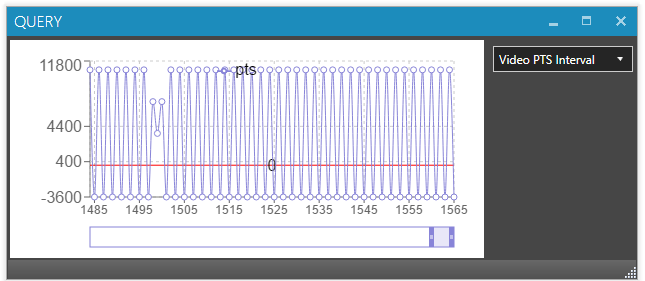
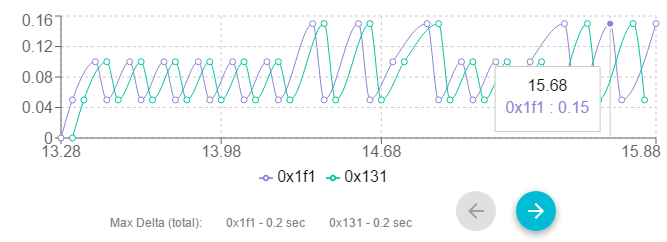
Video Pts Interval
Video Pts Interval chart shows the PTS time difference between successive video packets.
It is very similar to the DTS chart, but if you have B frames in your stream, the negative values are perfectly Ok (because of the frame reordering).
Data Pts Interval
Data Pts Interval chart shows the PTS time difference between successive data / klv packets (from the same pid).
- Note
- Please note that if you have an ASYNC Klv (or other private data with no PTS) there will be no PTS information available.
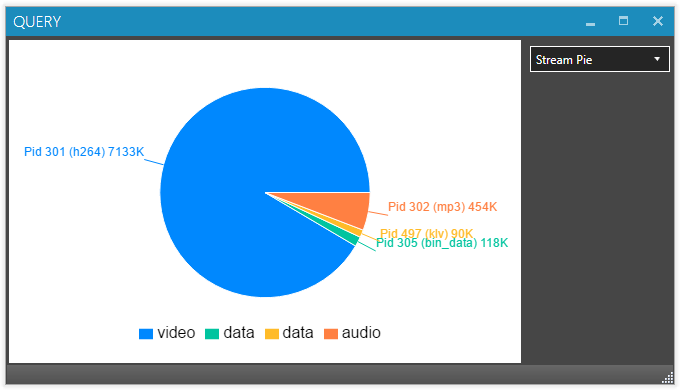
Stream Pie
The Stream Pie chart shows the distribution of the elementary streams found in the TS.
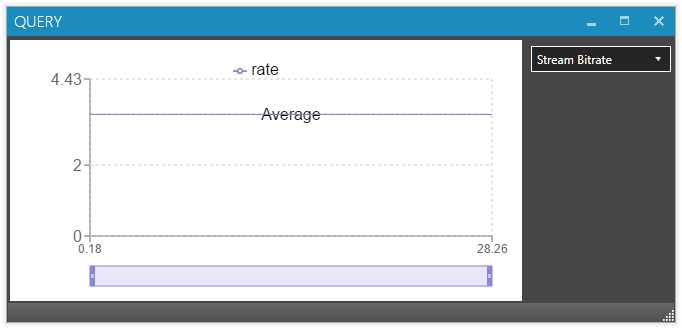
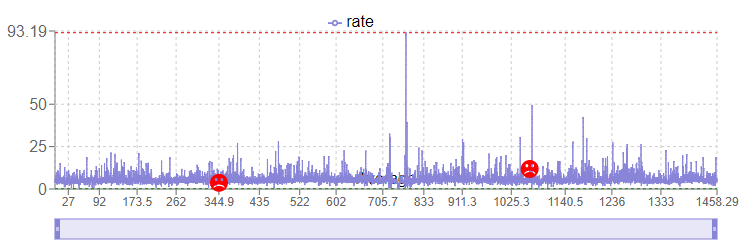
Stream Bitrate
The Stream Bitrate chart shows the stream bitrate measured using PCR timestamps found in the TS.
Here is an example of the CBR file.
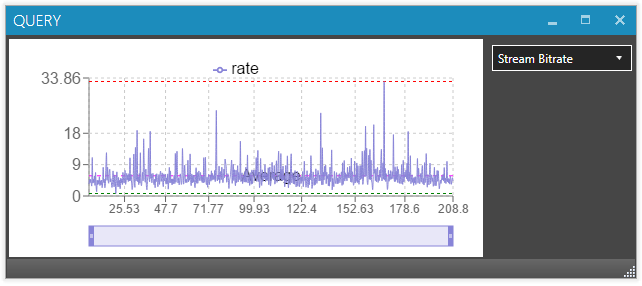
And that's how it looks for VBR.
If there are PCR discontinuities in the stream, they will be shown, as depicted below.
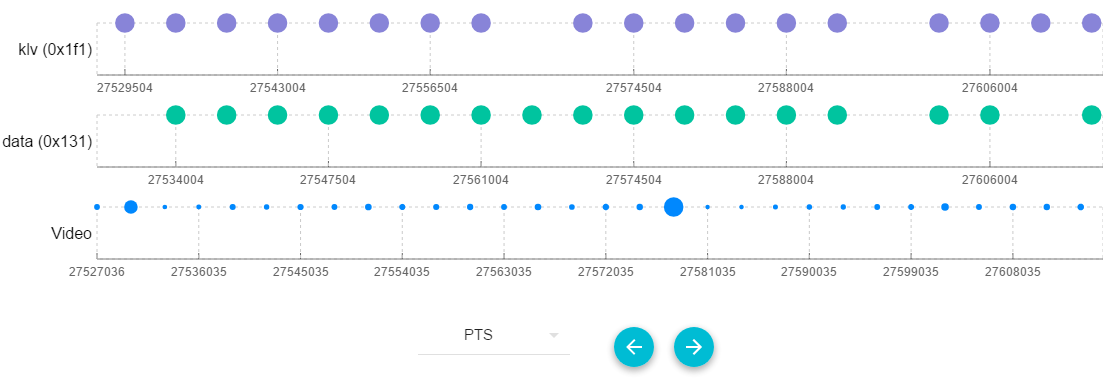
Video, Private Data and Klv packets
This chart demonstrates in a couple of ways how video, private data and Klv packets are multiplexed into the STANAG stream
First of all, we can evaluate how data packets are inserted into the stream (with relation to the video frames) by their byte offset (position)
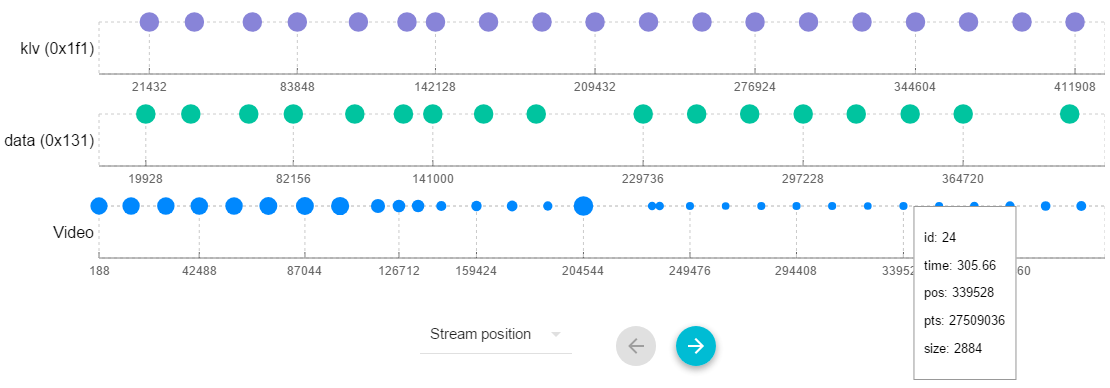
The tooltip on a packet will provide the following information:
- id - packet number
- pos - packet position (offset in bytes)
- time - packet time (from PTS values)
- delta - delta (in sec) between this and a previous packet
- pts - PTS value
- size - packet size (in bytes)
Next, looking at their PTS values (translated into time) we can see the placement with regard to the presentation time.
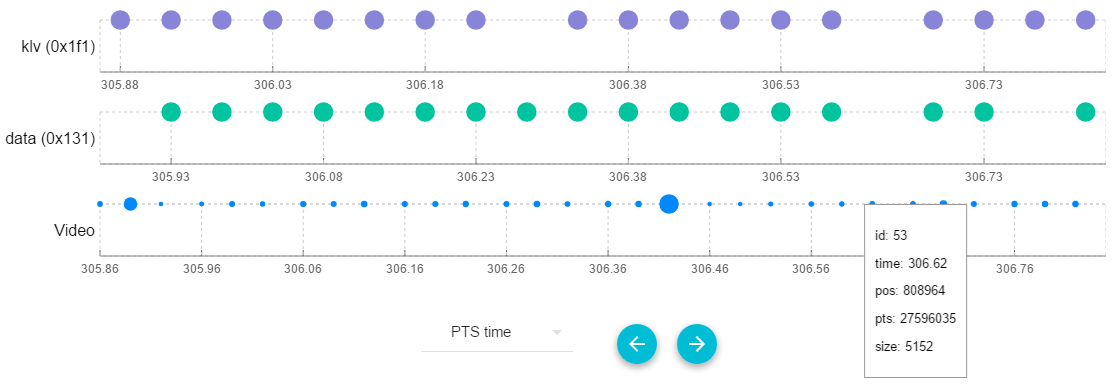
Or same as above, but with actual PTS values